
|
 |
|
Clearmain 8426 Lantern
For Osram Colour Corrected Mercury Lamps
|
Specification Clearmain 8426
Unfortunately the second and third pages of this catalogue is missing.
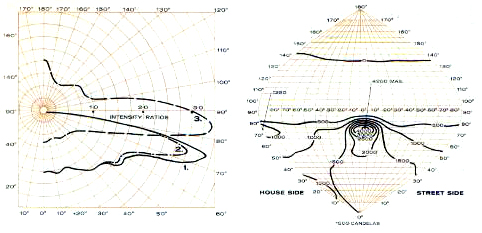 (1) Prinicple vertical polar curve.
(2) Polar curve in vertical plane parallel to street.
(3) Principle conical polar curve.
The above iso-candela diagram is based on an average lamp light output through life
from a
250-watt Osram MBF/U elliptical mercury lamp, 11,000 lumens average, applicable at
time of print.
| Light flux in lower hemisphere (lumens) |
7,800 |
See CP1004 Tables 10-16 |
| Downwards light output ratio |
0.71 |
No limits specified |
| Angle of elevation of upper limit of beam |
77° |
75° must be within beam |
| Angle of elevation of lower limit of beam |
70½° |
75° must be within beam |
| Peak intensity ratio |
3.4 |
1.8 to 4.0 |
| Maximum intensity ratio in the zone from 0° to 30° |
1.55 |
0.3 to 1.7 |
| Minimum intensity ratio in the zone from 0° to 30° |
1.13 |
0.3 to 1.7 |
| Maximum intensity ratio 0° to 30°/Peak intensity ratio |
0.45 |
0.7 maximum |
| Angle at which 1.2 intensity ratio occurs above the peak |
82½° |
78° to 84° |
| Intensity ratio at the horizontal |
0.13 |
0.6 Maximum |
| Divergence of beam centre from the axis of the road in azimuth |
5° |
15° Maximum |
Light distribution data are given for the guidance of the lighting engineer and represent the
average results of laboratory tests on a number of lanterns taken at random from stock.
The data are based on the lamp characteristics stated; if the latest lamp efficiency is different,
the candela or lumen values should be calculated in direct proportion to the relative lamp
lumens.
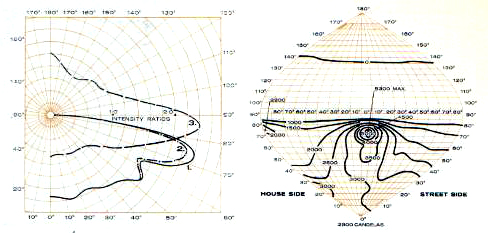 (1) Prinicple vertical polar curve.
(2) Polar curve in vertical plane parallel to street.
(3) Principle conical polar curve.
The above iso-candela diagram is based on an average lamp light output through life
from a
400-watt Osram MBF/U elliptical mercury lamp, 20,000 lumens average, applicable at
time of print.
| Light flux in lower hemisphere (lumens) |
13,800 |
See CP1004 Tables 10-16 |
| Downwards light output ratio |
0.69 |
No limits specified |
| Angle of elevation of upper limit of beam |
77° |
75° must be within beam |
| Angle of elevation of lower limit of beam |
68½° |
75° must be within beam |
| Peak intensity ratio |
2.4 |
1.8 to 4.0 |
| Maximum intensity ratio in the zone from 0° to 30° |
1.58 |
0.3 to 1.7 |
| Minimum intensity ratio in the zone from 0° to 30° |
1.23 |
0.3 to 1.7 |
| Maximum intensity ratio 0° to 30°/Peak intensity ratio |
0.56 |
0.7 maximum |
| Angle at which 1.2 intensity ratio occurs above the peak |
82° |
78° to 84° |
| Intensity ratio at the horizontal |
0.14 |
0.6 Maximum |
| Divergence of beam centre from the axis of the road in azimuth |
4° |
15° Maximum |
|
|
|